As the name implies, Chrome Developer Tools is a set of web developer tools built directly into the Google Chrome browser that allows web developers to interfere and manipulate applications via the browser. With this tool you can easily:
- View and change page’s styles
- Debug Javascript Code
- Analyze runtime performance, so you can optimize your code
- View messages and running JavaScript in the Console
To open DevTools, you can right-click anywhere on the page and select inspect element or you can choose the “tools > developer tools” option from the top right menu.
Now I’m going to show you some really useful and simple examples of the DevTool in use:
1. Edit a HTML Element
You have to:
- Go to the “Elements” panel.
- Choose a DOM element within the Elements Panel editor.
- Double click on the opening tag and edit it.
When you are finished, the closing tag is automatically updated.
Simple right?

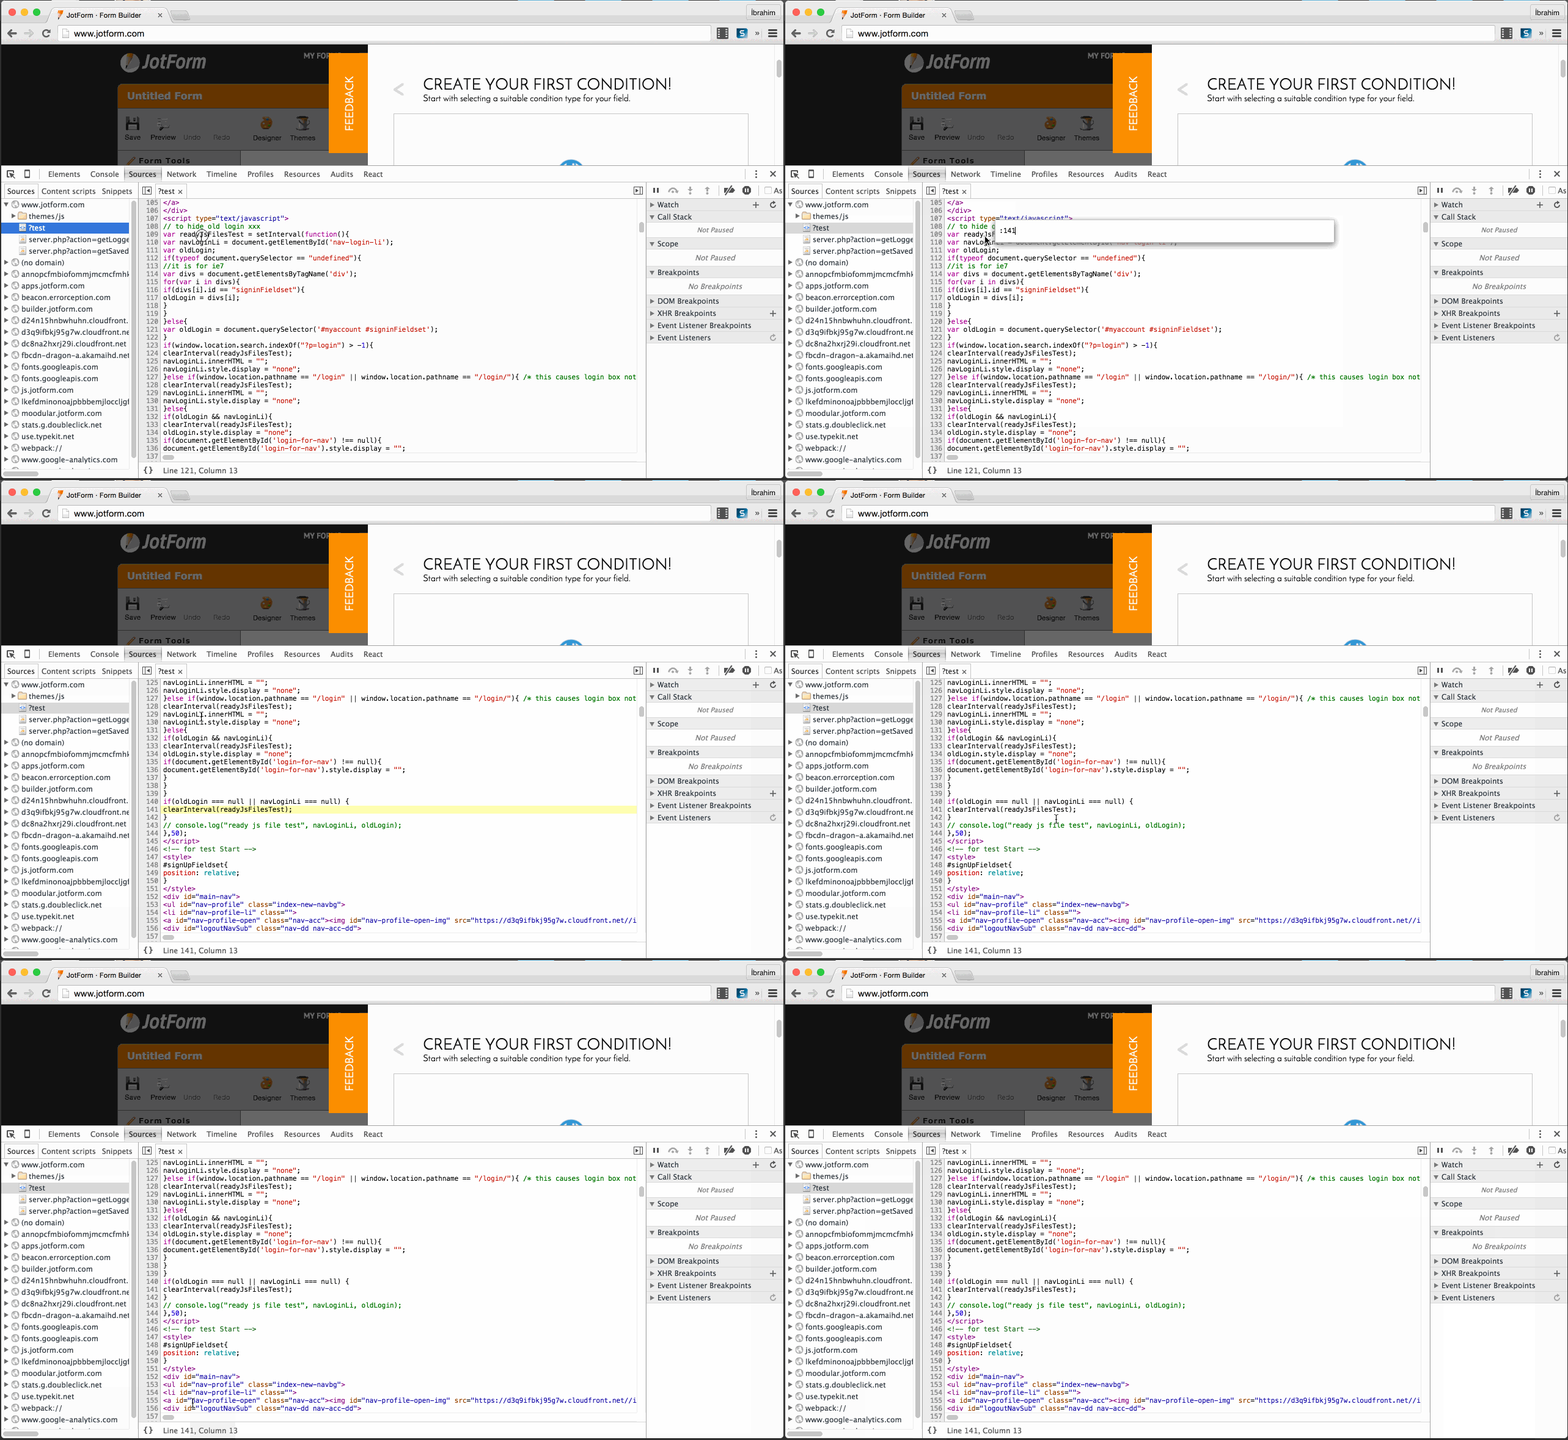
2. Go to a Line Number
First you have to go to the Sources panel. There you can use this feature in the “:linenumber:columnnumber” format.
To try it:
- Press CMD + O and type your number

3. Expand All Child Nodes
To try it:
- Select the “Elements” panel.
- Choose a DOM element and Alt + Click the arrow within the Elements Panel editor to expand all child nodes.

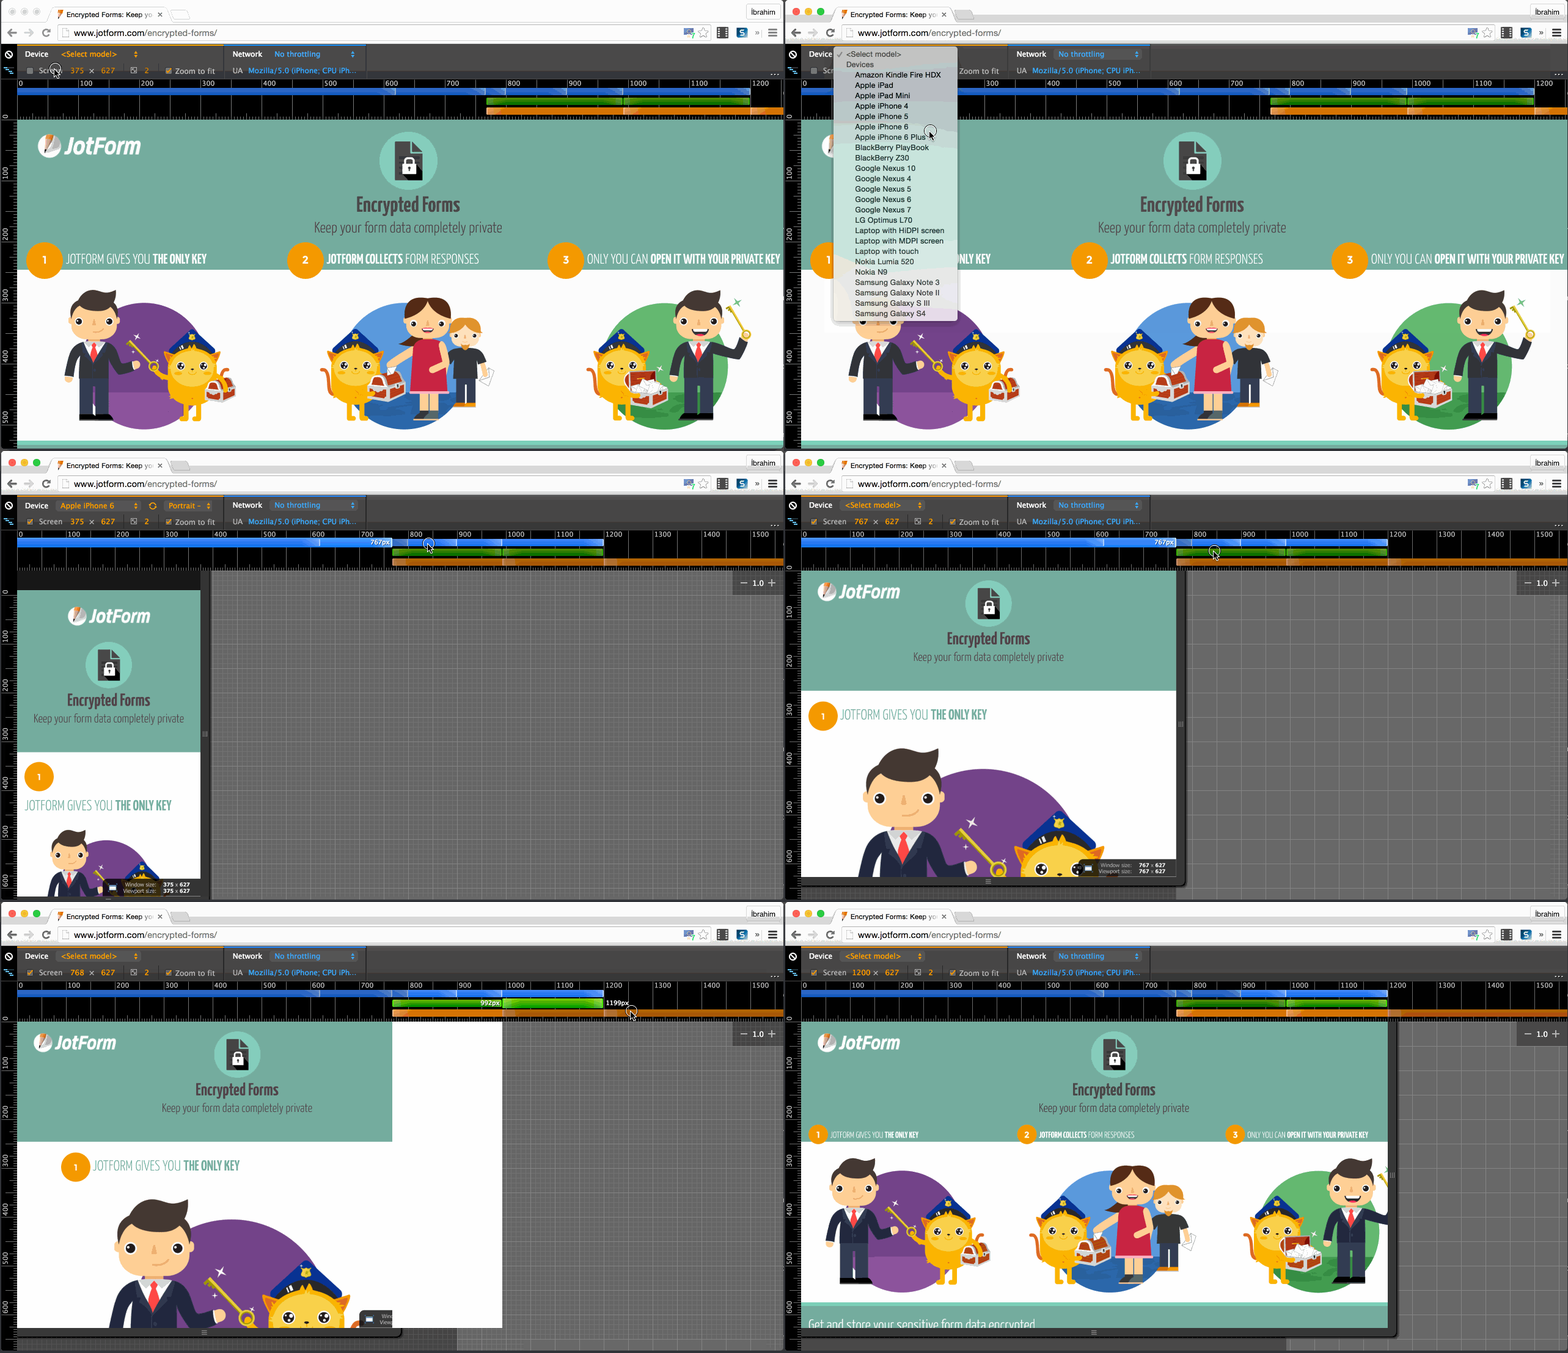
4. Make it Responsive
If you want to check how your website is showing in different screen sizes, this will be really useful.
To try yo should:
- Go to Device Mode, click the tablet and mobile icon in the upper left corner of the page.
- Select a Responsive behavour and then click the breakpoint (‘blue’, ‘green’, ‘orange’) bars and change.
- Also, you can view defined mobile or tablet sizes.
If you right click on a bar, you can reveal its position within the source code.

I hope you learned something and you can apply it to your coding!

